added 132 characters in body
Source Link
Carl
  • 13.3k
  • 8
  • 18

Some research to examine downvoting was performed. The top 500 CV users with respect to reputation were examined with respect to clusters of downvotes using visual inspection then k-means for two populations performed with Mathematica v. 13.0.0. enter image description here

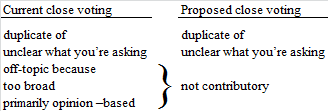
The selections off topic, too broad and primarily opinion based are currently being used as alternatives for not-contributory. Those alternatives, even taken together, do not span not-contributory such that current practice is not really addressing the need to prune the site for content that is just not up to par value for expert opinionopinion; low quality, not expert question and so forth.

For answers, there is no closure voting per se. However, there is flagging which provides similar functionality, but requires review at my reputation level.

Some research to examine downvoting was performed. The top 500 CV users with respect to reputation were examined with respect to clusters of downvotes using visual inspection then k-means for two populations. enter image description here

The selections off topic, too broad and primarily opinion based are currently being used as alternatives for not-contributory. Those alternatives, even taken together, do not span not-contributory such that current practice is not really addressing the need to prune the site for content that is just not up to par value for expert opinion.

For answers, there is no closure voting per se. However, there is flagging which provides similar functionality.

Some research to examine downvoting was performed. The top 500 CV users with respect to reputation were examined with respect to clusters of downvotes using visual inspection then k-means for two populations performed with Mathematica v. 13.0.0. enter image description here

The selections off topic, too broad and primarily opinion based are currently being used as alternatives for not-contributory. Those alternatives, even taken together, do not span not-contributory such that current practice is not really addressing the need to prune the site for content that is just not up to par value for expert opinion; low quality, not expert question and so forth.

For answers, there is no closure voting per se. However, there is flagging which provides similar functionality, but requires review at my reputation level.

added 307 characters in body
Source Link
Carl
  • 13.3k
  • 8
  • 18

This shows three clusters. Note that reciprocal scaling was used on the $y$-axis to produce a dependent variable distribution that was indistinguishable from a uniform distribution. Also, square root transformation of the $x$-axis data removed much of the heavy right-tailed appearance. Visual inspection was used to identify the zero percentage downvoter population as cluster analysis proved problematic for that purpose. Subsequently, k-means did a good job of isolating two populations that were relatively independent of reputation level. From this, and although there seems to be a tendency for increased downvoting with increased reputation, one can still achieve good separation between downvoting populations from the cluster analysis. As a two dimensional histogram this looks like the following enter image description here

All 500 high repuation users upvoted. There are three statistically distinct voter populations for percentage downvoting:

  1. 13.6% never downvoted; 0% downvote percentage of total votes.

  2. 68.0% downvoted at a median percentage of their total votes of 2.79%, 95% of whom downvoted between 0.20% to 9.23% of the time, and

  3. 18.4% who downvoted at a median percentage of their total votes of 19.0%; between 9.87% to 67.1%, 95% of the time.

The best cut point between populations 2. and 3. was approximately at 9.79%; the 96.1 percentile population overlap point between populations.

It would seem that downvoting follows at least three very different behaviours. Consequently, from the viewpoint of the recipient of these downvotes, a downvote is rather easier to attribute to a random event than a rational one, i.e., it may seem to depend more on who is voting than the content of the post being voted upon.

For this author, this suggests that if downvoting behaviour were more systematized, it would be more transparent for the user.

Addendum on 2018-12-05 Given the copious feedback, I am collating the results, if slowlydid further processing. @NickCox suggested using folded square root of percentage downvotes, $\sqrt{x}-\sqrt{100-x}$, on the $x$-axis. This worked well in SPSS in version 13, (old but good), using two-step cluster analysis followed by k-means for a variable number of clusters with the best clustering chosen by BIC. This show the following plot. Two-step cluster analysis showed that classification by reciprocal reputation failed $t$-testing. The cluster data forwarded to k-means then yielded two clusters as below.

The selections off topic, too broad and primarily opinion based are currently being used as alternatives for not-contributory to the site. Those alternatives, even taken together, do not span not-contributory such that current practice is not really addressing the need to prune the site for content that is just not up to par value for expert playopinion.
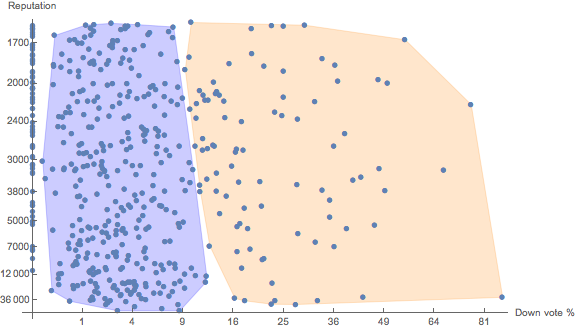
This shows three clusters. Note that reciprocal scaling was used on the $y$-axis to produce a dependent variable distribution that was indistinguishable from a uniform distribution. Also, square root transformation of the $x$-axis data removed much of the heavy right-tailed appearance. Visual inspection was used to identify the zero percentage downvoter population as cluster analysis proved problematic for that purpose. Subsequently, k-means did a good job of isolating two populations that were relatively independent of reputation level. From this, and although there seems to be a tendency for increased downvoting with increased reputation, one can still achieve good separation between downvoting populations from the cluster analysis. As a two dimensional histogram this looks like the following enter image description here

All 500 high repuation users upvoted. There are three statistically distinct voter populations for percentage downvoting:

  1. 13.6% never downvoted; 0% downvote percentage of total votes.

  2. 68.0% downvoted at a median percentage of their total votes of 2.79%, 95% of whom downvoted between 0.20% to 9.23% of the time, and

  3. 18.4% who downvoted at a median percentage of their total votes of 19.0%; between 9.87% to 67.1%, 95% of the time.

The best cut point between populations 2. and 3. was approximately at 9.79%; the 96.1 percentile population overlap point between populations.

It would seem that downvoting follows at least three very different behaviours. Consequently, from the viewpoint of the recipient of these downvotes, a downvote is rather easier to attribute to a random event than a rational one, i.e., it may seem to depend more on who is voting than the content of the post being voted upon.

For this author, this suggests that if downvoting behaviour were more systematized, it would be more transparent for the user.

Addendum on 2018-12-05 Given the copious feedback, I am collating the results, if slowly. @NickCox suggested using folded square root of percentage downvotes, $\sqrt{x}-\sqrt{100-x}$, on the $x$-axis. This worked well in SPSS in version 13, (old but good), using two-step cluster analysis followed by k-means for a variable number of clusters with the best clustering chosen by BIC. This show the following plot. Two-step cluster analysis showed that classification by reciprocal reputation failed $t$-testing. The cluster data forwarded to k-means then yielded two clusters as below.

The selections off topic, too broad and primarily opinion based are currently being used as alternatives for not-contributory to the site. Those alternatives, even taken together, do not span not-contributory such that current practice is not really addressing the need to prune the site for content that is just not up to par value for expert play.

This shows three clusters. Note that reciprocal scaling was used on the $y$-axis to produce a dependent variable distribution that was indistinguishable from a uniform distribution. Also, square root transformation of the $x$-axis data removed much of the heavy right-tailed appearance. Visual inspection was used to identify the zero percentage downvoter population as cluster analysis proved problematic for that purpose. Subsequently, k-means did a good job of isolating two populations that were relatively independent of reputation level.

Addendum Given the copious feedback, I did further processing. @NickCox suggested using folded square root of percentage downvotes, $\sqrt{x}-\sqrt{100-x}$, on the $x$-axis. This worked well in SPSS in version 13, (old but good), using two-step cluster analysis followed by k-means for a variable number of clusters with the best clustering chosen by BIC. This show the following plot. Two-step cluster analysis showed that classification by reciprocal reputation failed $t$-testing. The cluster data forwarded to k-means then yielded two clusters as below.

The selections off topic, too broad and primarily opinion based are currently being used as alternatives for not-contributory. Those alternatives, even taken together, do not span not-contributory such that current practice is not really addressing the need to prune the site for content that is just not up to par value for expert opinion.

added 307 characters in body
Source Link
Carl
  • 13.3k
  • 8
  • 18

Weibull distributions also best fit the original downvote data without square rooting. No matter how I tried to fit the histogram data, the results were not significantly different from Weibull distributions. ThisIn absolute terms, this cannot be a Weibull distribution as such a distribution has values beyond 100% downvoting. However, the Weibull result may be relevant as one interpretation of the Weibull distribution relates to diffusion of innovation. As per Weibull "In the context of diffusion of innovations, the Weibull distribution is a "pure" imitation/rejection model...In the context of the diffusion of innovations, this [Sic, $\alpha>1$ (As it is herein), where $\alpha$ is the Weibull shape parameter] means positive word of mouth: the hazard function is a monotonically increasing function of the proportion of adopters. The function is first convex, then concave with an inflexion point at $1-e^{-1/\alpha}$ [Sic, notation translated]"

Thus, there is statistical evidence for two groups of adopters beyond the 0% group, who are "non-adopters". This is evidence for an admixture of downvoting strategies that does not agree with the opinion as voiced in some comments that such a phenomenon does not exist in this data. Such an admixture of voting patterns for downvoting is opaque to the recipient of such votes. That is, although we can sort this out statistically, the individual downvote recipient has no such clues, which implies that downvoting is not efficient and not clean from the user's POV. One remedy for this could be to shunt some of this downvoting in the high downvoting rate category to a closure vote on the contributory/non-contributory opinion axis as this would provide clarity as to what a downvote means for the user while doing a more direct job of addressing material that is non-contributory for the more expert reviewer. We do have off topic for questions, but not for answersas follows. Worse,

enter image description here

The selections off topic, too broad and primarily opinion based are currently being used as alternatives for not-contributory to the site. Those alternatives, even taken together, do not span not-contributory such that current practice is not really addressing the need to prune the site for content that is just not up to par value for expert play.

For answers, there is no closure voting per se. However, there is flagging which provides similar functionality.

Weibull distributions also best fit the original downvote data without square rooting. No matter how I tried to fit the histogram data, the results were not significantly different from Weibull distributions. This may be relevant as one interpretation of the Weibull distribution relates to diffusion of innovation. As per Weibull "In the context of diffusion of innovations, the Weibull distribution is a "pure" imitation/rejection model...In the context of the diffusion of innovations, this [Sic, $\alpha>1$ (As it is herein), where $\alpha$ is the Weibull shape parameter] means positive word of mouth: the hazard function is a monotonically increasing function of the proportion of adopters. The function is first convex, then concave with an inflexion point at $1-e^{-1/\alpha}$ [Sic, notation translated]"

Thus, there is statistical evidence for two groups of adopters beyond the 0% group, who are "non-adopters". This is evidence for an admixture of downvoting strategies that does not agree with the opinion as voiced in some comments that such a phenomenon does not exist in this data. Such an admixture of voting patterns for downvoting is opaque to the recipient of such votes. That is, although we can sort this out statistically, the individual downvote recipient has no such clues, which implies that downvoting is not efficient and not clean from the user's POV. One remedy for this could be to shunt some of this downvoting in the high downvoting rate category to a closure vote on the contributory/non-contributory opinion axis as this would provide clarity as to what a downvote means for the user while doing a more direct job of addressing material that is non-contributory for the more expert reviewer. We do have off topic for questions, but not for answers. Worse, off topic, too broad and primarily opinion based are currently being used as alternatives for not-contributory to the site. Those alternatives, even taken together, do not span not-contributory such that current practice is not really addressing the need to prune the site for content that is just not up to par value for expert play.

Weibull distributions also best fit the original downvote data without square rooting. No matter how I tried to fit the histogram data, the results were not significantly different from Weibull distributions. In absolute terms, this cannot be a Weibull distribution as such a distribution has values beyond 100% downvoting. However, the Weibull result may be relevant as one interpretation of the Weibull distribution relates to diffusion of innovation. As per Weibull "In the context of diffusion of innovations, the Weibull distribution is a "pure" imitation/rejection model...In the context of the diffusion of innovations, this [Sic, $\alpha>1$ (As it is herein), where $\alpha$ is the Weibull shape parameter] means positive word of mouth: the hazard function is a monotonically increasing function of the proportion of adopters. The function is first convex, then concave with an inflexion point at $1-e^{-1/\alpha}$ [Sic, notation translated]"

Thus, there is statistical evidence for two groups of adopters beyond the 0% group, who are "non-adopters". This is evidence for an admixture of downvoting strategies that does not agree with the opinion as voiced in some comments that such a phenomenon does not exist in this data. Such an admixture of voting patterns for downvoting is opaque to the recipient of such votes. That is, although we can sort this out statistically, the individual downvote recipient has no such clues, which implies that downvoting is not efficient and not clean from the user's POV. One remedy for this could be to shunt some of this downvoting in the high downvoting rate category to a closure vote on the contributory/non-contributory opinion axis as this would provide clarity as to what a downvote means for the user while doing a more direct job of addressing material that is non-contributory for the more expert reviewer, as follows.

enter image description here

The selections off topic, too broad and primarily opinion based are currently being used as alternatives for not-contributory to the site. Those alternatives, even taken together, do not span not-contributory such that current practice is not really addressing the need to prune the site for content that is just not up to par value for expert play.

For answers, there is no closure voting per se. However, there is flagging which provides similar functionality.

added 2336 characters in body
Source Link
Carl
  • 13.3k
  • 8
  • 18
Loading
added 6 characters in body
Source Link
Carl
  • 13.3k
  • 8
  • 18
Loading
added 812 characters in body
Source Link
Carl
  • 13.3k
  • 8
  • 18
Loading
added 122 characters in body
Source Link
Carl
  • 13.3k
  • 8
  • 18
Loading
added 293 characters in body
Source Link
Carl
  • 13.3k
  • 8
  • 18
Loading
added 1260 characters in body
Source Link
Carl
  • 13.3k
  • 8
  • 18
Loading
Source Link
Carl
  • 13.3k
  • 8
  • 18
Loading